Your agents are guessing at your enterprise data.
Wise Generative Ontology is the context layer between agents and the systems that actually run your business — trade, CRM, ERP, market measurement, manufacturing. It lets any agent or external MCP read that data accurately, efficiently and under governance, instead of inferring meaning from column names and getting it wrong.

One layer, sitting where the meaning is missing
Agents are good at language and bad at your schema. Your enterprise systems are the reverse. Wise sits between them and holds the meaning — so every agent, yours or a third party's, works from the same governed definitions.
Who may ask what, whether the answer was right, and what it cost.
Real observed behaviour.
structured per industry.
Nothing is copied out. The ontology is written back into your catalog as governed metadata, so the data stays where it is and your existing permissions keep applying.
Enterprise data alone cannot tell an agent what matters
Your systems record what happened inside your business. They contain no signal about what consumers are actually doing, and no vocabulary an agent can reason with. Prism supplies both.

A generative consumer panel
Built on real observed behaviour rather than survey recall — what people actually cook, order, post and buy. Continuously refreshed, so the vocabulary does not rot between planning cycles.
Grounded in market data
Retail, location and place data provide the market context on the other side of the ontology — so a claim can be tied to shelf presence and geography, not just to conversation.
Structured per industry
Sourced and modelled separately for each vertical, because the entities that matter in food are not the entities that matter in beauty or household. CPG and retail today.
What that looks like in food & beverage, today
The food instantiation of Prism is live and in production — a curated taxonomy of 11,199 ingredients and 1,311 claims across 15 categories, applied continuously to observed consumer behaviour:
This is the part a customer cannot build in-house. A keyword list is a quarter of work; the observed-behaviour corpus and its ongoing curation are not.
A claim column that is 64% negative
Here is what an agent faces in a real market-measurement table: 4,319,714 rows,
77 columns, 64 of them named like pi_vegan_qlfd with no
definition anywhere. They are strings, not booleans — and this is a food example only
because that is where we started. The failure mode is identical in any vertical.
-- what is actually in the column?
SELECT pi_vegan_qlfd, COUNT(*)
FROM   products GROUP BY 1;

 (null)        3,479,872
 NOT VEGAN       535,698   ← 64% of populated
 VEGAN           304,144

-- the natural query an agent writes
WHERE pi_vegan_qlfd IS NOT NULL
   …counts both.
And it is not the worst one
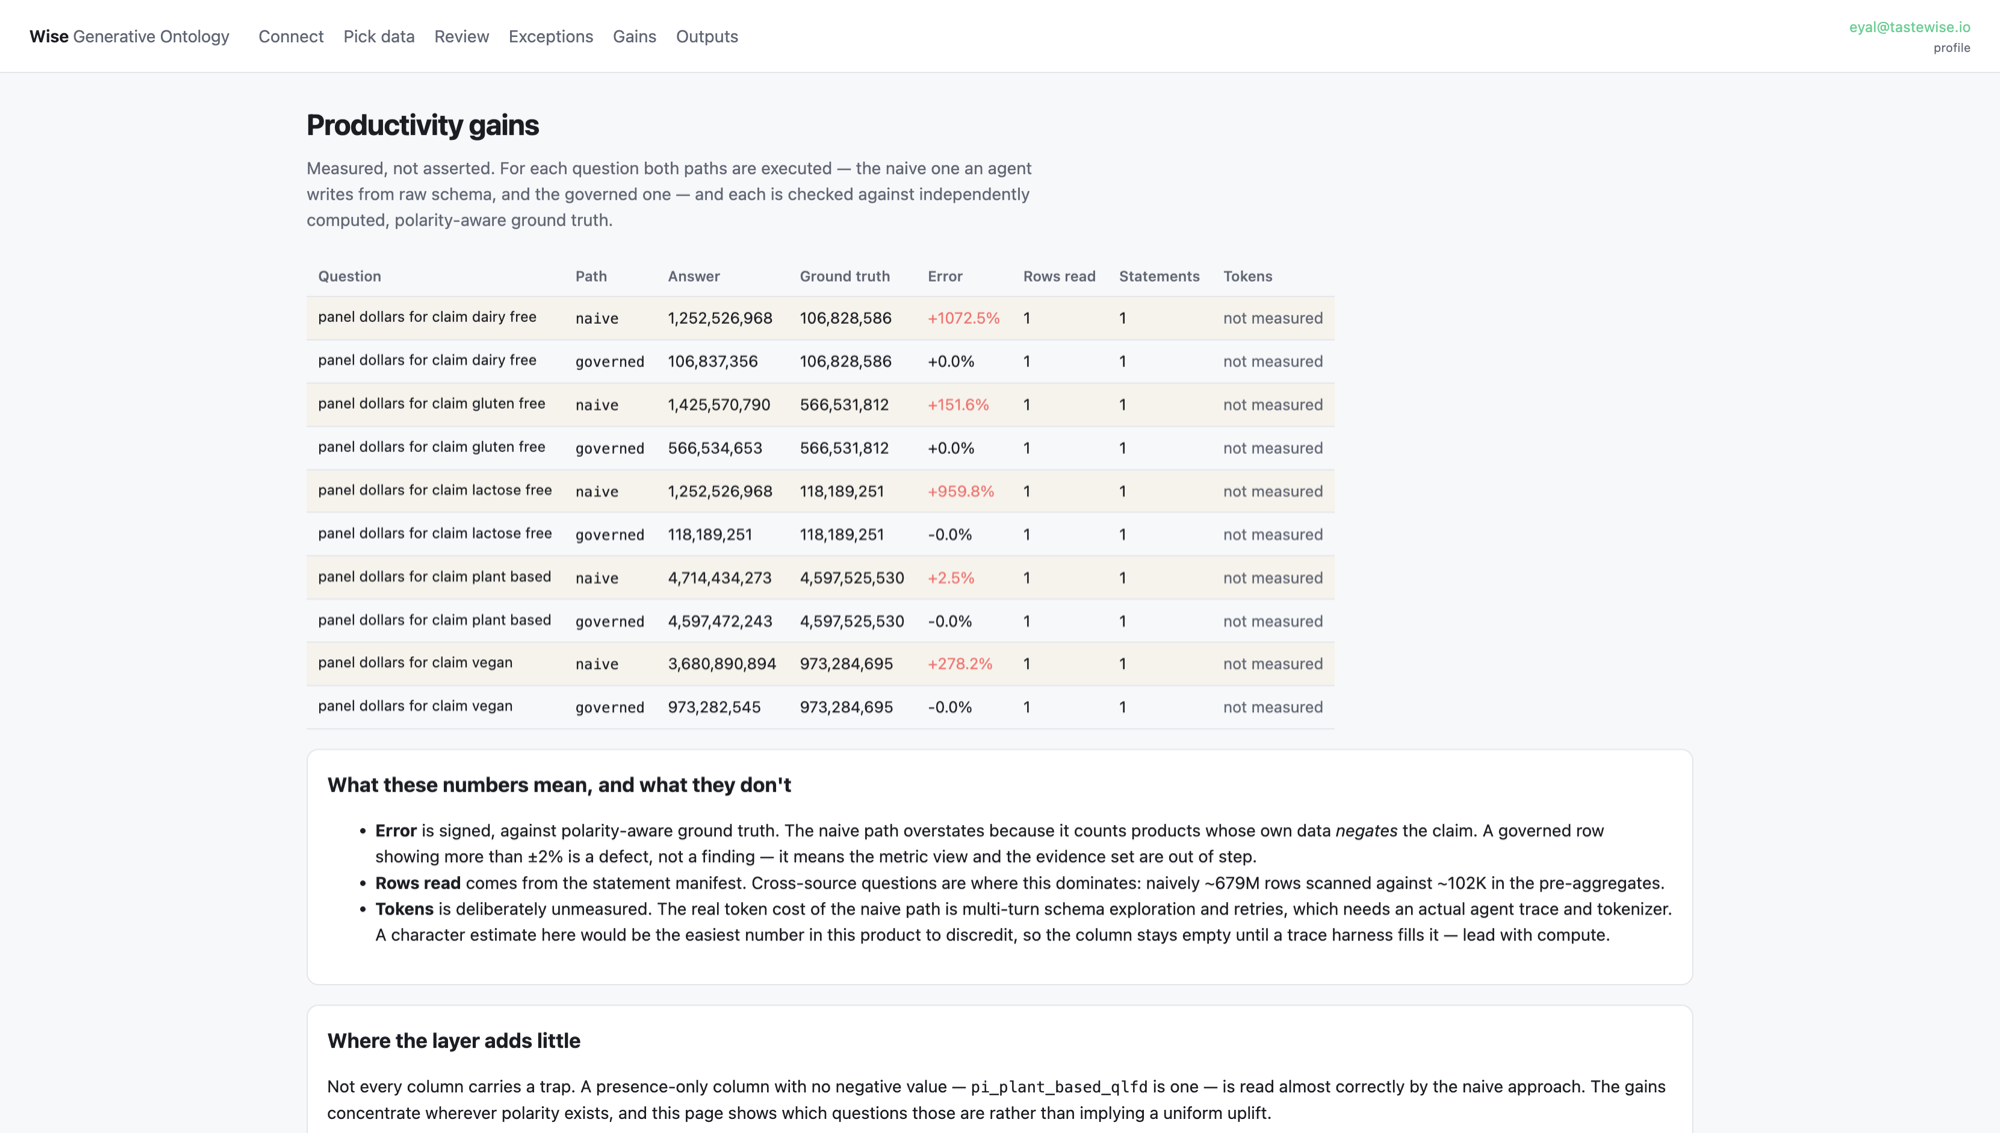
| Claim | Naive | True | Error |
|---|---|---|---|
| dairy free | 1,252,526,968 | 106,828,586 | +1,072% |
| lactose free | 1,252,526,968 | 118,189,251 | +960% |
| vegan | 3,680,890,894 | 973,284,695 | +278% |
| gluten free | 1,425,570,790 | 566,531,812 | +152% |
| plant based | 4,714,434,273 | 4,597,525,530 | +3% |
That last row matters. pi_plant_based_qlfd has no
negative value, so the naive read is nearly right and we add almost nothing. The
value is concentrated wherever polarity exists — and we tell you exactly which
columns those are.
Four more things nobody had written down
pi_keto_diet_qlfd reads cleanly as “keto” and has
0 of 4,319,714 rows. Map it by name and you ship a dimension that
returns nothing, forever.A mapping never points at a meaning alone
Every other semantic layer records “this column means gluten free”. That is what breaks. A mapping has to carry a sign, an evidence basis and a scope — or it will confidently invert your numbers.
+ polarity ASSERTS NEGATES LEVEL UNKNOWN
+ evidence STATED — from the label QUALIFIED — from analysis
+ scope market · language · version
CONTAINS GLUTEN is not a different entity from
gluten free — it is the same entity with the sign flipped.
And polarity is relative: CONTAINS PROBIOTICS
asserts a desirable claim while CONTAINS GLUTEN
negates a freedom claim. Treating “contains” as negation everywhere inverts meaning in
the other direction.
Cheap to expensive, and profiling wins
Five layers. The first is a veto, not an enrichment.
Profile the data
Row, null and distinct counts; exact key uniqueness; byte-identical duplicates. Emits verdicts that override every layer below. A confident name over an empty column is worse than no mapping at all.
Read the column name
Strips prefixes, maps suffixes to evidence basis, expands industry shorthand. Proposes a concept only — a name cannot tell you the sign.
Match the values against Prism
The actual value domain against the industry taxonomy and its curated synonyms. This is where polarity is decided, because polarity lives in the values.
Resolve free text
Product names and descriptions to entities, using the same matcher that tags the Prism corpus — so your data and the consumer signal land in one vocabulary.
Ask a model, last
In-warehouse classification over a shortlist of ≤20 candidates, never the full vocabulary. Every result is a proposal, staged for human approval. Nothing reaches your catalog unreviewed.
Five surfaces, one vocabulary
1 · Your own columns, described
Comments and queryable tags written onto your tables in place. Columns that said nothing now state what they mean, how the evidence was established, and how confident we are. Nothing is copied and nothing is moved.
2 · Governed metrics
Measures defined once so every BI tool, notebook and agent reads the same numbers. Asserted values only, keys deduplicated, and data coverage exposed as a first-class measure rather than a footnote.
3 · A queryable ontology
13,159 entities and 58,965 hierarchy edges, so “everything under plant-based alternatives” becomes a query instead of a guess. Today that hierarchy lives in a text file and cannot be asked at all.
4 · Agent tools & MCP
Governed functions any agent can call, running under the caller's identity — so row-level security applies to an agent exactly as it applies to a person. External MCP servers register against the same vocabulary and receive canonical entity IDs, never your raw column values.
5 · A natural-language agent that inherits every caveat
Its instructions are generated from the ontology, not hand-written — every polarity trap, empty column and duplicate pair becomes a rule. Asked which diet claims have the most products, it wrote the correct governed SQL and then volunteered this, unprompted:
“Soy free is asserted on nearly every product, so its high count is not a meaningful differentiator among diet claims.”
Nobody wrote that sentence. A profiling query found 98.36%, the generator turned it into an instruction, and it surfaced in plain English to a business user.
Not a mockup
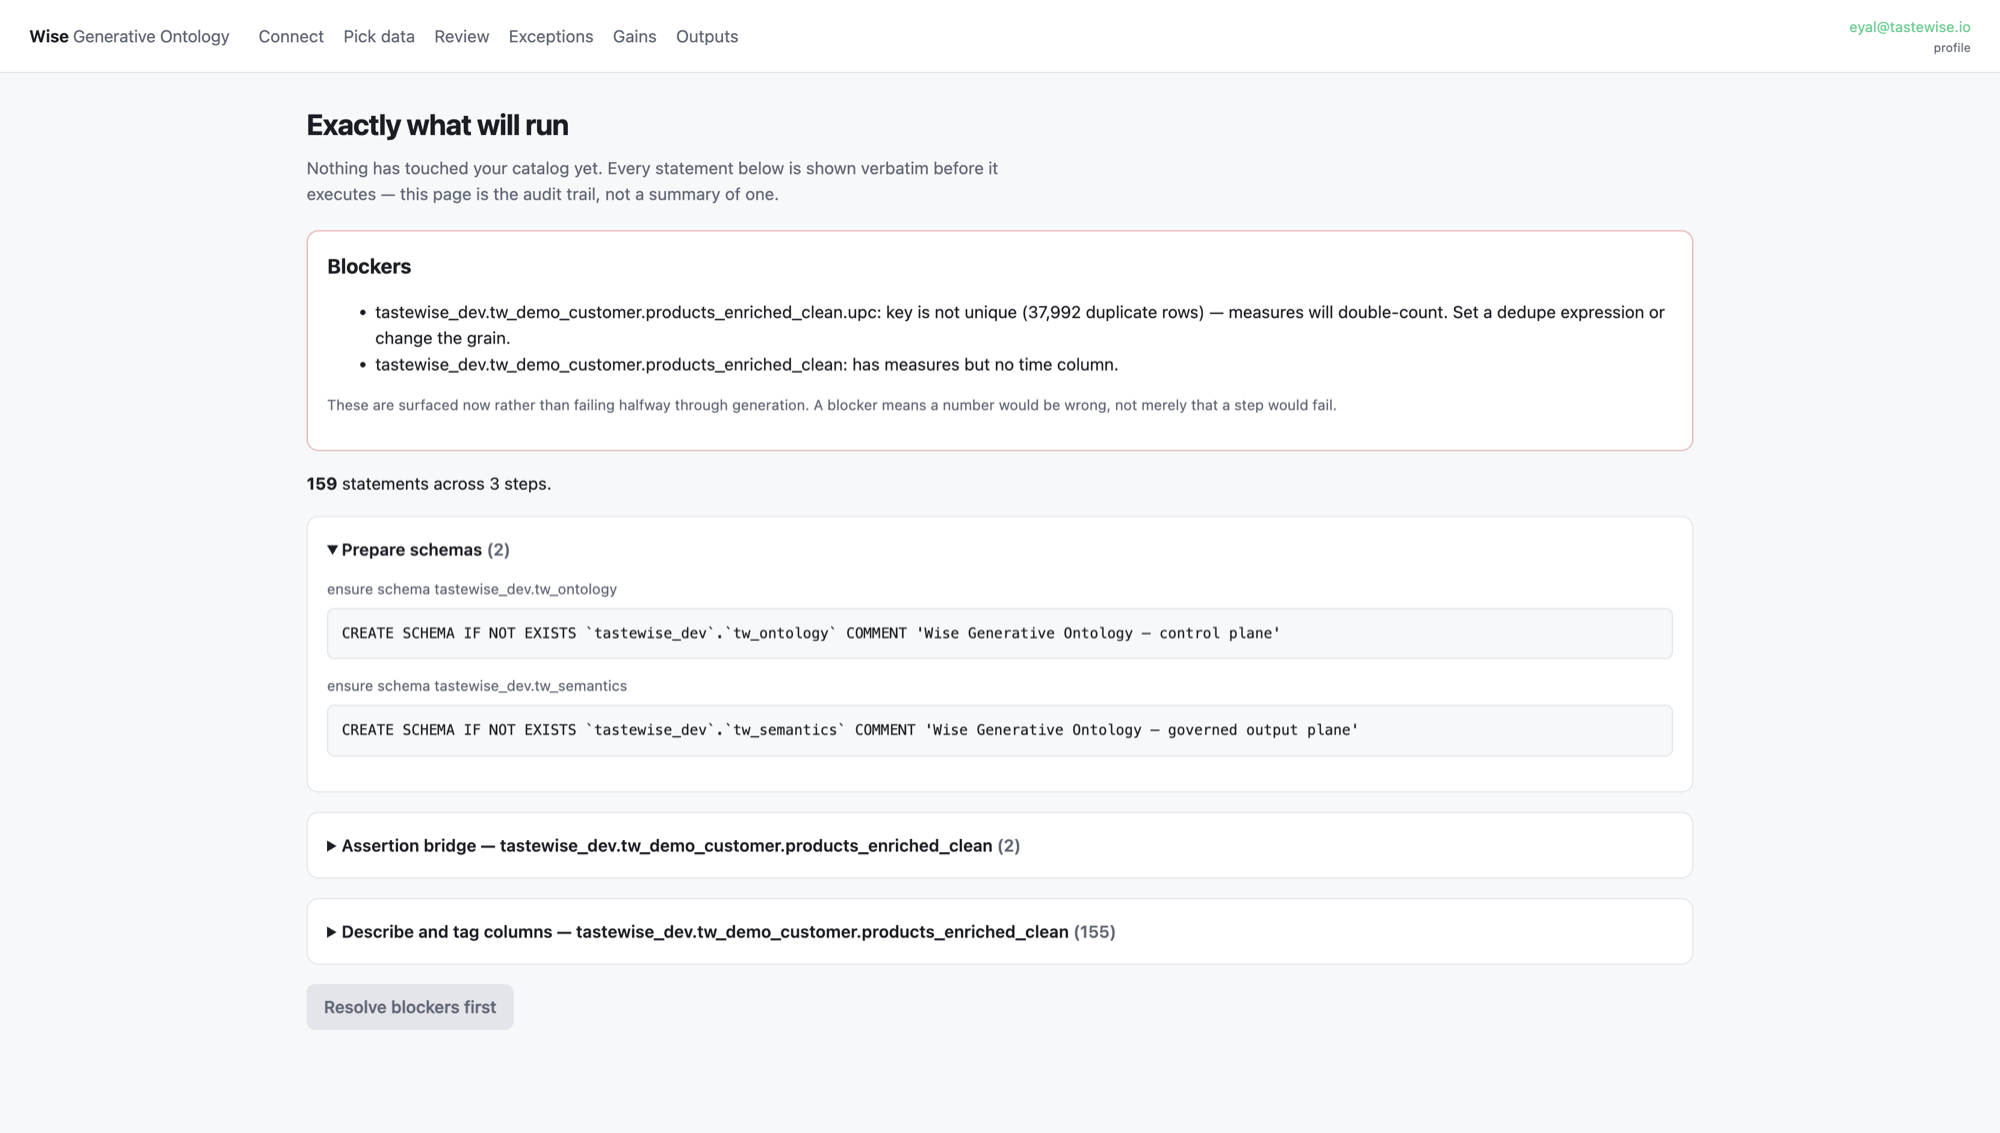
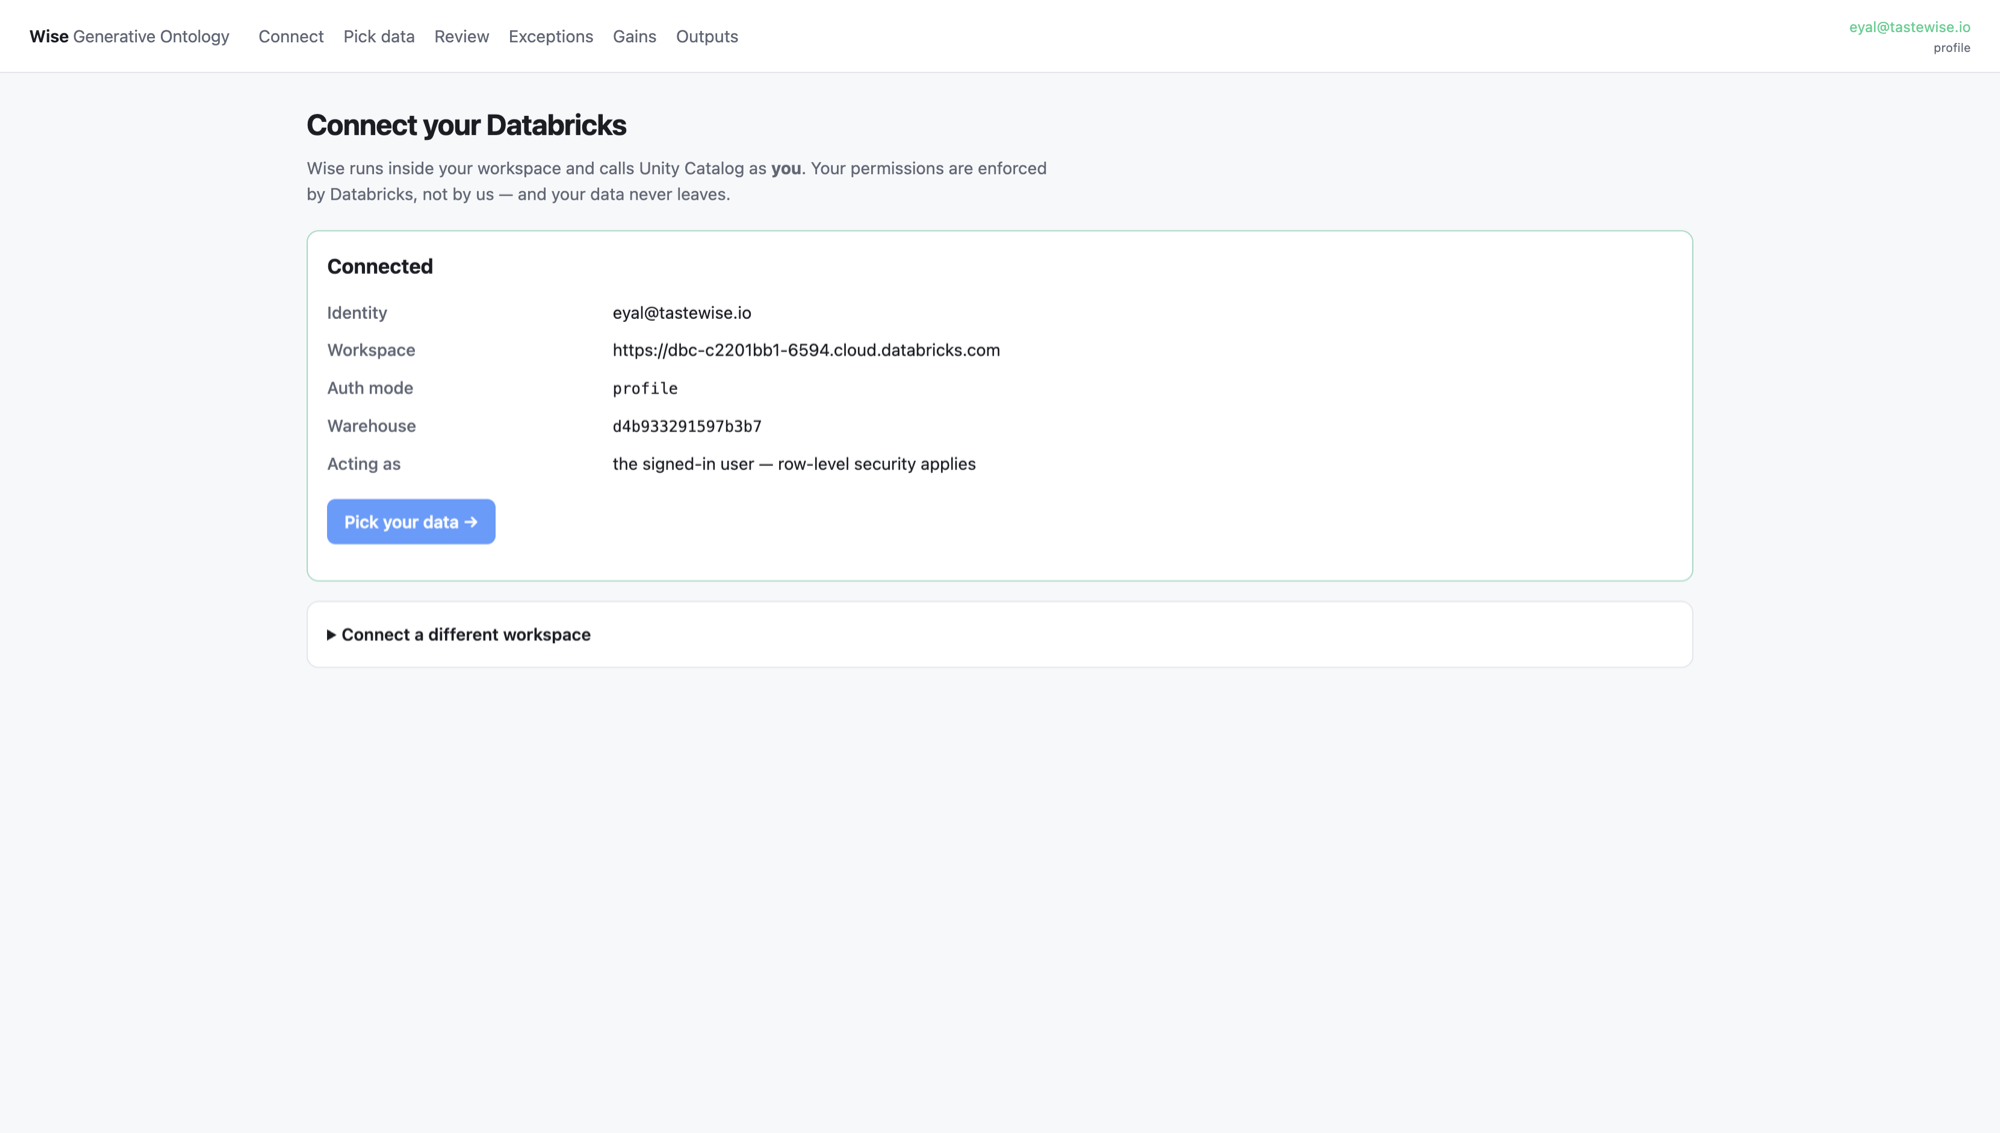
Wise deploys inside your environment and calls your catalog as the signed-in user, so permissions are enforced by your platform rather than by us. Every screen below is the real product against a 4,319,714-row table.
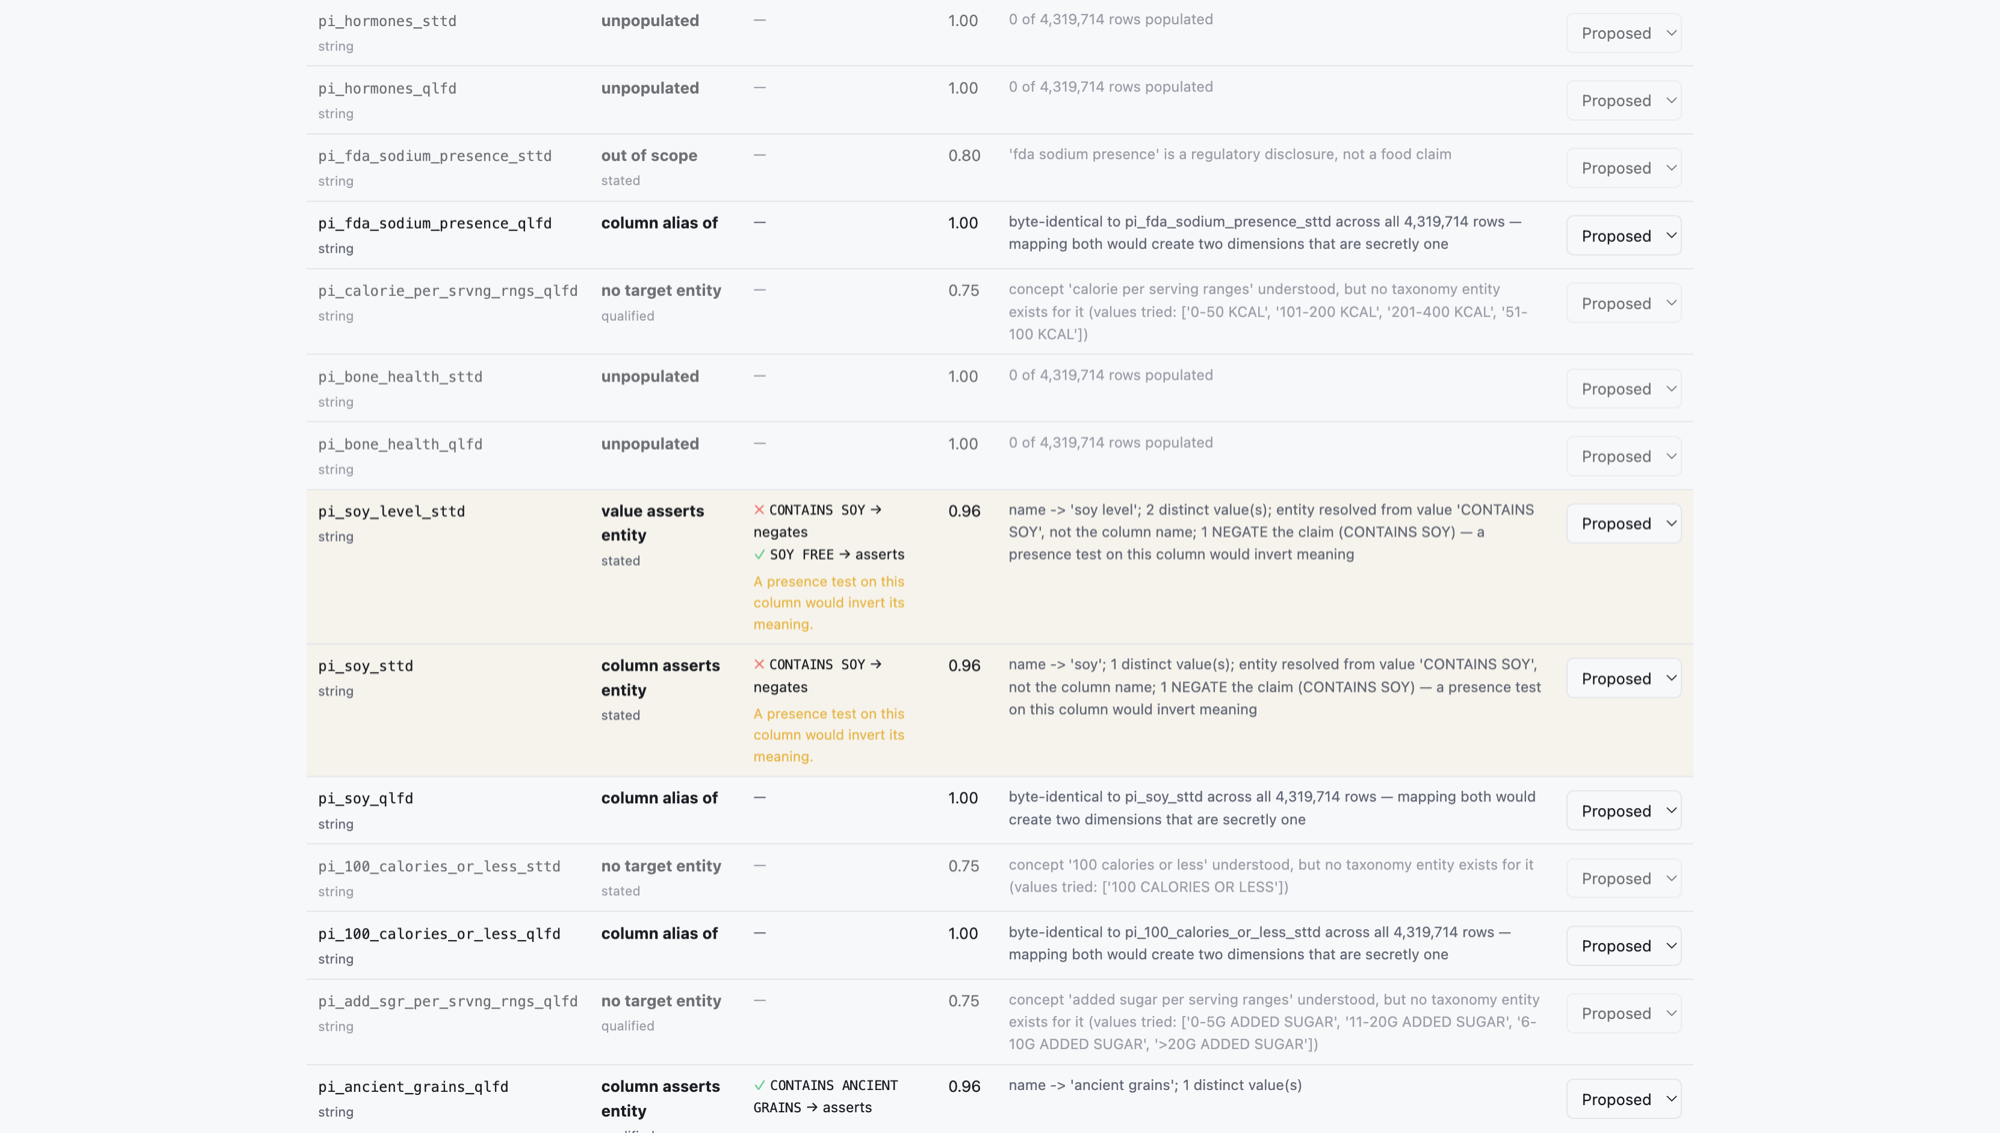
pi_soy_level_sttd shows
✗ CONTAINS SOY → negates and
✓ SOY FREE → asserts, with the
warning that a presence test would invert its meaning. Below it,
pi_soy_qlfd is flagged byte-identical to
pi_soy_sttd, and three columns are marked no target
entity — concepts we understand that the taxonomy has no home for yet. Nothing is
applied until a human accepts it.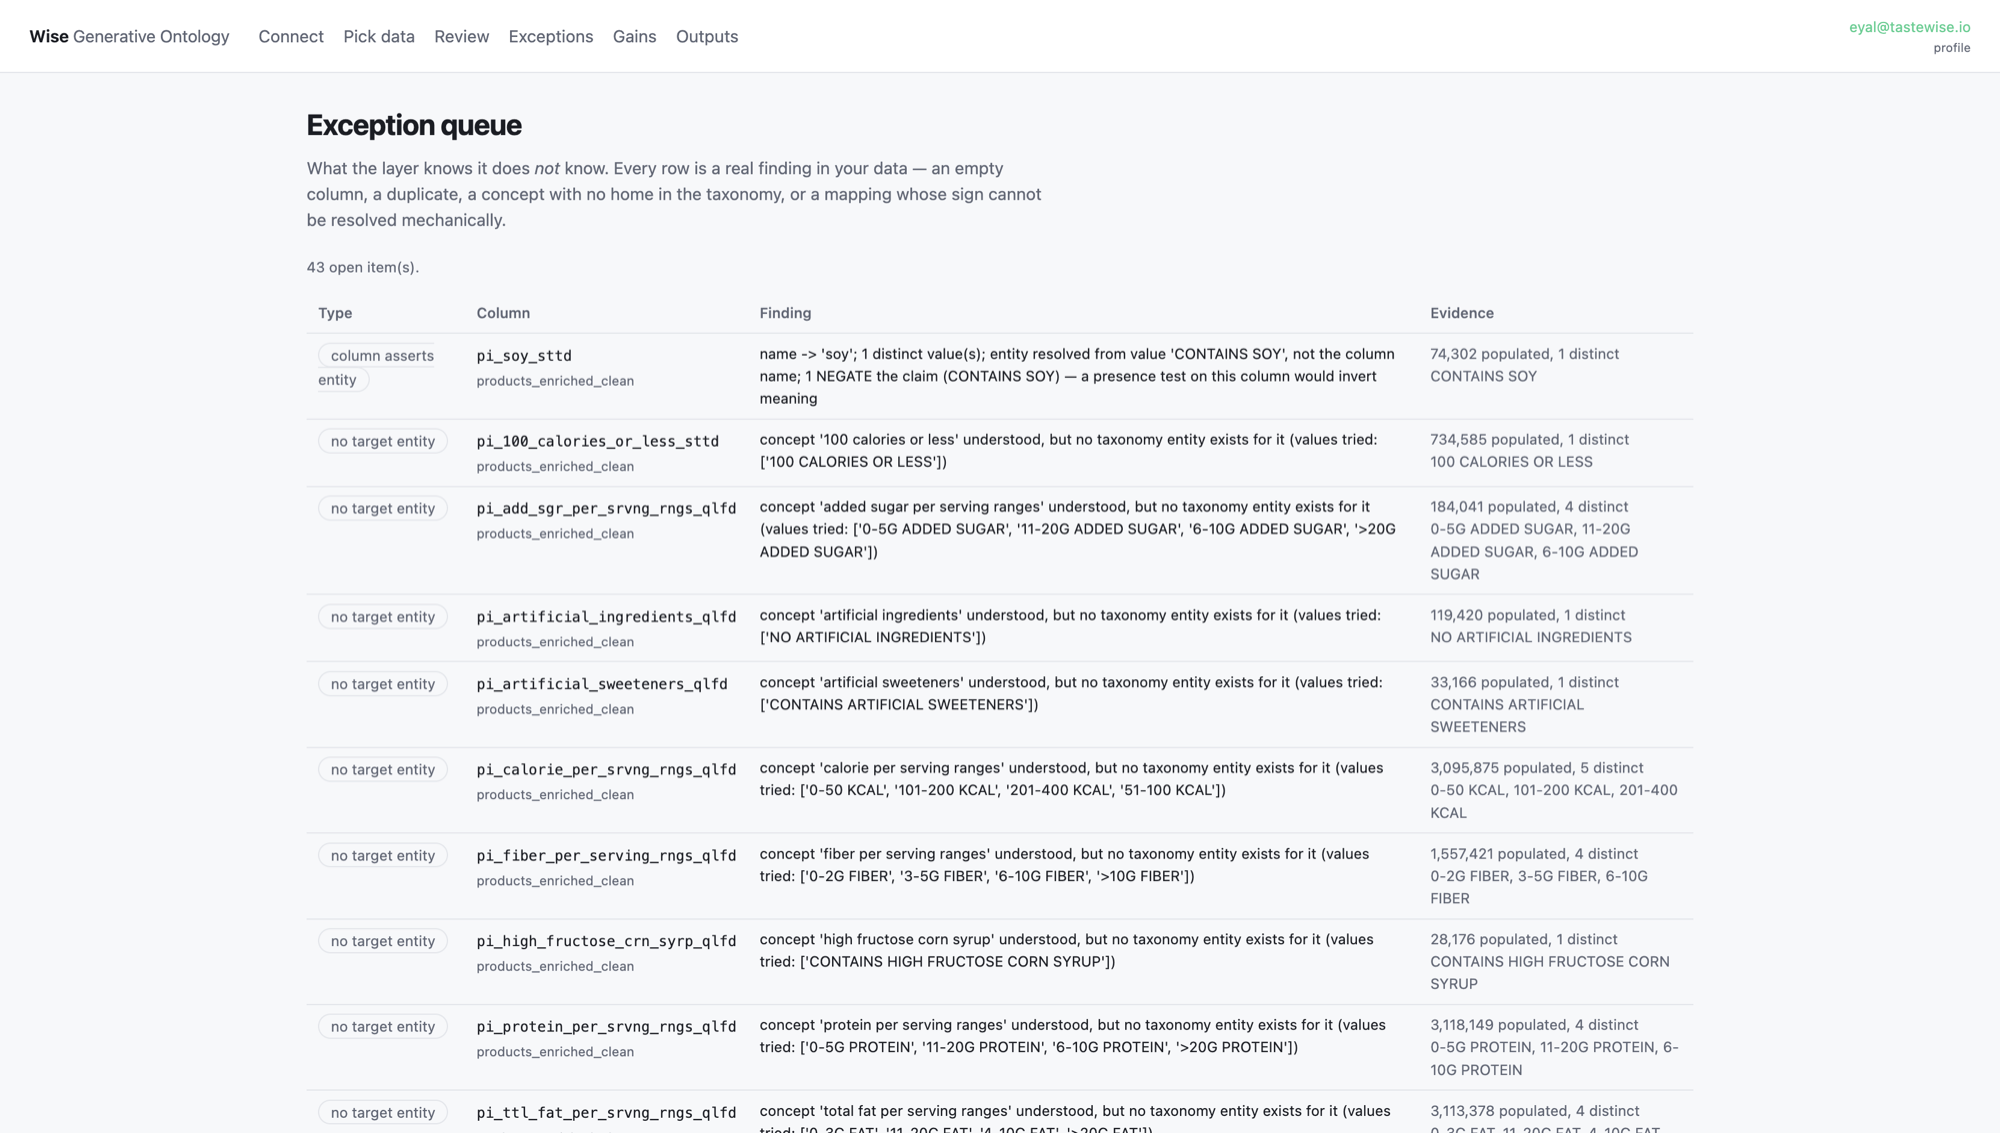
Checked against the data owner's own answer
For one claim, our tags versus the syndicated provider's own rating of the same products:
And it costs less to ask
~679M raw fact rows against ~102K in governed pre-aggregates. Measured from query telemetry, not estimated.
What we do not claim
We publish no token-savings number. The real saving is fewer exploratory turns and fewer retries, and quantifying that honestly needs a real agent trace. We would rather leave the field empty than print a figure you could pull apart in a meeting.
What this is not
The fastest way to lose a data team is to oversell. So, plainly:
- Prism is deepest in food and beverage. That is where the observed-behaviour corpus and taxonomy are production-grade today. Other CPG and retail categories are structured per industry as we bring them on — ask us where a given category actually stands rather than assuming parity.
- Panel figures are labelled panel. The dollar figures on this page come from an imputed household panel, not measured retail sales, and coverage varies by claim from 10.6% to 96.3%. Coverage travels with every measure. Measured data is the spine for sizing; panel is for discovery.
- We do not invent relationships. Substitution and composition are declared in the model and shipped empty, because the data does not support them. A vendor claiming derived substitutes is guessing.
- Nothing reaches your catalog unreviewed. Every mapping is a proposal with its evidence attached. Approval is a human step, and the review screen shows the exact statements before any of them run.
- The gains are not uniform. On a column with no negative value we add almost nothing, and we say so — see the +3% row above.
The exception queue is the point
Empty columns, duplicate columns, concepts with no home in the taxonomy, mappings whose sign cannot be settled mechanically, evidence conflicts — including 1,524 products where the pack claims gluten free and ingredient analysis disagrees. A layer that tells you what it does not know is the only kind worth trusting with a number you will take to a retailer.
Point it at your own systems
Connect a workspace, pick a few tables, and get the exception queue for your data in an afternoon. It runs inside your environment and your data never leaves it.